Clinical Discovery Research Reagents
Advancing clinical discovery research
With our Clinical Discovery Research Reagents (CDRR) we want to help clinical researchers advance their clinical discovery. Our recently expanded portfolio of antibodies and bright fluorescent dyes enables BD to offer a broad selection of kits to advance your clinical research needs.

Discover our latest addition to the CDRR portfolio
BD Horizon™ Tumor & Tissue Dissociation Reagent

Efficiency
Maximizes the cell yields during dissociation, while minimising cell death

Stability
One-year shelf life at 2-8°C
Existing kit offering you improved stability
BD Horizon™ Dri TBNK+CD20

Reduced variability
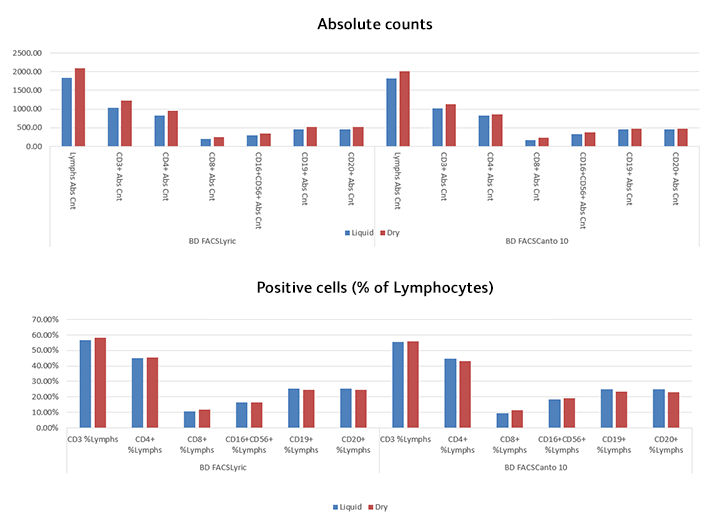
The kits can be used across labs and sites to help improve research consistency

Stability
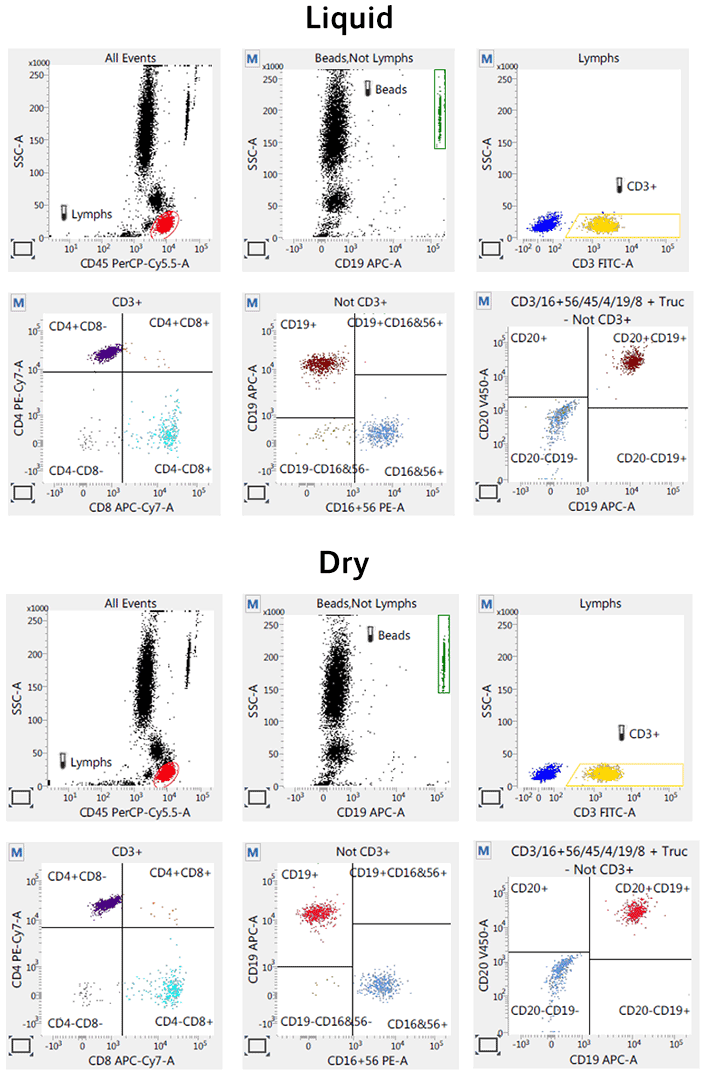
With the introduction of our dry panel offerings, you receive improved shelf life over liquid cocktails and storage at room temperature
BD Horizon™ Tumor & Tissue Dissociation Reagent
MORE PRODUCTS DETAILS
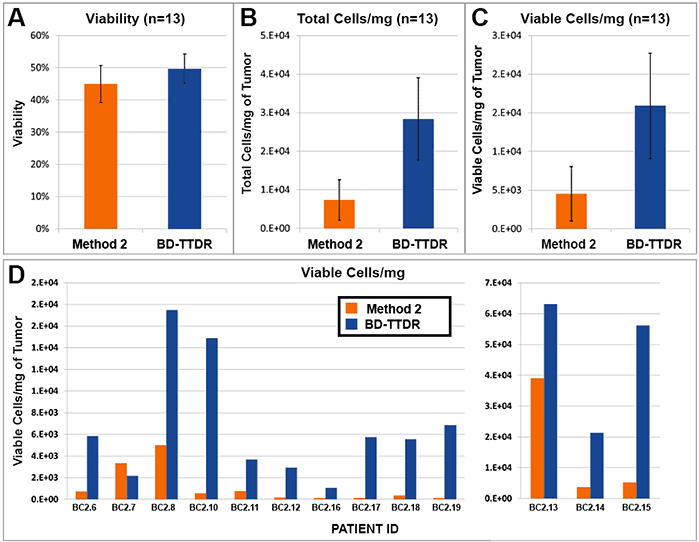
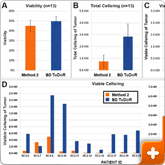
Figure 1. Cell yield and viability
13 breast cancer biopsies were processed in parallel via Method 2 (current popular market offering) and using the BD workflow. Procedure for Method 2 was followed per manufacturer's instructions. The BD workflow consisted of manual mechanical mincing of tumor followed by 30 minute incubation with BD Horizon™ Dri Tumor & Tissue Dissociation Reagent (BD-TTDR). Samples were filtered using a 70 micron filter and single cell suspensions were analyzed on an automated cell counter. Mean visibility (A) total cell yield (B) and viable cells/mg of tumor processed (C). Viable cells/mg for each of the 13 biopsies processed are shown in D. Viability across the two methods was comparable; however, the total number of cells liberated was consistently and significantly higher using the BD workflow.
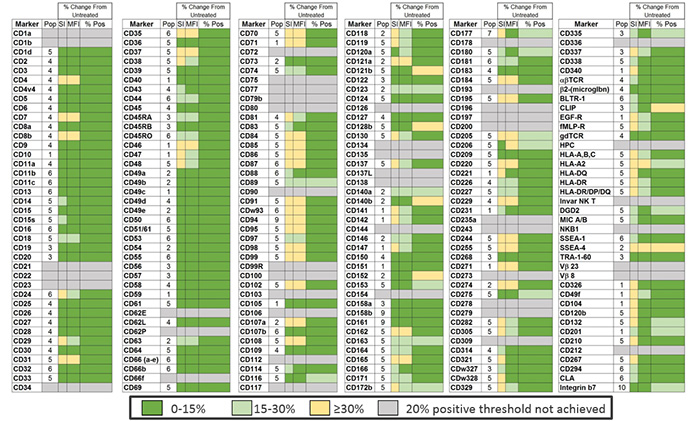
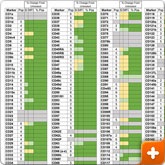
Figure 2. Epitope Preservation
Surface marker expression was assessed across the BD catalog in a mixed sample of two different cancer cell lines (RWPE-1 and MDA-MB-231) and PBMC from a donor pool (stimulated & unstimulated with PHA for 18 hrs). A total of 10 different populations were defined in this mixed sample: 1- RWPE, 2- MDA-MB-231, 3-unstimulated non-T cells (CD3-), 4-unstimulated T cells (CD3+), 5-unstimulated monocytes, 6-unstimulated granulocytes, 7-stimulated non-T cells (CD3-), 8-stimulated T cells (CD3+), 9-stimulated monocytes and 10-stimulated granulocytes. For each marker, a single population (T cells, non-T cells etc.) was chosen for the analysis. This target population is indicated by a number (1-10) that references these population assignment numbers (column heading is “Pop”). The mixed cell sample was then exposed to TTDR for 30 minutes or left untreated. Markers that demonstrated less than 20% expression are represented as grey boxes; 47 total markers. Untreated and treated (exposed to enzyme) samples were compared using Stain Index (SI), Median Fluorescence Intensity (MFI) of positive signal and the % of the population that was clearly positive for a given marker (% Pos). Dark green indicates a change of less than 15%, light green indicates a change of 15-30% and yellow indicates a change of 30% or more compared to the untreated control.

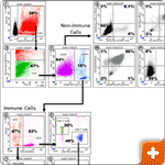
Figure 3. Flow cytometry sample data
Expression of cell surface markers on dissociated tumor cells. A solid tumor biopsy from a breast cancer patient was dissociated using the BD Horizon™ Dri Tumor & Tissue Dissociation Reagent (BD-TTDR). The cell suspension was stained for surface markers to identify immune infiltrates (CD45+ cells) and non-immune cells, e.g. cancer cells (CD45- cells). Dot plots are numbered in the upper left hand corner. 1) Hoechst 33342 vs. SSC; debris is gated out and nucleated cells are identified for further analysis.2) FSC vs. Amine live/dead; amine negative events denote live, nucleated cells. 3) CD45 vs. SSC; Live nucleated CD45+ immune cells were further analyzed for subset composition (dot plots 4-7) and CD45- non-immune cells were further analyzed for expression of known cancer cell markers (dot plots 8-11). The samples were analyzed on SORP Fortessa cytometer using FACSDiva software.
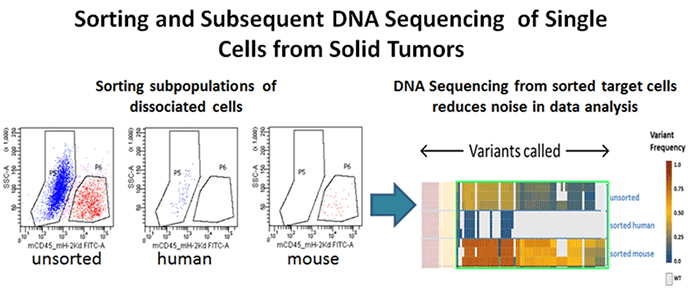
Figure 4. Genomic analysis
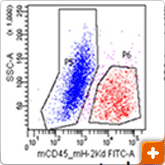
Xenograft breast tumors were dissociated into single-cell suspensions using the BD Horizon™ Dri Tumor & Tissue Dissociation Reagent (BD-TTDR) following the protocol described above. Human tumor cells and mouse infiltrates were sorted based on species specificity as defined by expression of mouse CD45+ H-2kd. The purity of the sorted cell populations as measured by flow cytometry was >98%. Using the 2 sorted populations along with the unsorted to purify genomic DNA and further NGS sequencing using the Ion Torrent Cancer Hotspot panel v.2, a range of variants was detected with intermediate signal strength in the unsorted population, demonstrating that sorting of target cells prior to NGS analysis minimises the noise due to contaminating cell populations.
BD Horizon™ Dri TBNK+CD20
MORE PRODUCTS DETAILS
BD support and information
MORE INFORMATION
Yes I would like to know more! Please ask a BD representative to contact me


 AACR Poster 2015