Total Spread Matrices for the BD Leukocyte Panel Blocks
What is a Total Spread Matrix (TSM)?
While designing multicolor flow cytometry panels, it is important to assess fluorescence spillover to prevent or minimize loss of resolution due to spreading. The Spillover Spread Matrix (SSM) was developed as a tool to monitor and compare instrument performance over time, especially when experiments are standardized or calibrated across different
instruments.(1)
The SSM is independent of fluorochrome brightness. While this feature is important for the comparison of instruments, it may lead to inaccurate spread prediction and sub-optimal panel design. The Total Spread Matrix (TSM) is the Spillover Spreading Matrix without normalization to the fluorescent intensity of the probe. This makes it possible to evaluate the true spreading in a given panel, based on the signal intensity of the different marker/fluorochrome combinations in each channel.
Please note for all tables shown below, the spread displayed is only found on the subpopulations that are positive for a given marker.
To view the instrument configuration on which these TSMs were collected, please scroll down.
Lymphocyte Backbone Panel Block
| Total Spread Matrix | BUV615 | BUV661 | BUV737 | BV421 | BV480 | BV605 | BV650 | BV711 | BV750 | BV786 | BB515 | BB630 | BB660 | BB700 | RB744 | RB780 | PE | PE-CF594 | PE-Cy5 | APC |
| BUV395 CD4 | 11 | 21 | 21 | 0 | 0 | 60 | 24 | 13 | 40 | 26 | 0 | 13 | 21 | 17 | 22 | 29 | 29 | 26 | 18 | 22 |
| BUV496 CD8 | 15 | 56 | 43 | 0 | 78 | 94 | 36 | 25 | 57 | 40 | 18 | 10 | 24 | 29 | 22 | 39 | 55 | 55 | 0 | 48 |
| BUV563 CD19 | 18 | 53 | 35 | 0 | 0 | 72 | 0 | 8 | 23 | 0 | 0 | 38 | 35 | 17 | 22 | 10 | 169 | 120 | 48 | 45 |
| BUV805 CD45 | 13 | 36 | 62 | 31 | 17 | 65 | 29 | 20 | 121 | 118 | 21 | 23 | 22 | 22 | 48 | 113 | 38 | 38 | 15 | 31 |
| PE-Cy7 CD56 | 12 | 22 | 14 | 17 | 0 | 0 | 10 | 18 | 82 | 41 | 0 | 0 | 16 | 28 | 148 | 284 | 28 | 40 | 16 | 18 |
| R718 HLA-DR | 0 | 22 | 230 | 0 | 0 | 22 | 22 | 44 | 218 | 92 | 0 | 1 | 37 | 34 | 56 | 116 | 15 | 0 | 46 | 128 |
| APC-H7 CD3 | 9 | 26 | 36 | 0 | 16 | 57 | 25 | 22 | 140 | 123 | 24 | 22 | 25 | 22 | 48 | 140 | 24 | 32 | 29 | 44 |
Table 1. A representative TSM showing the impact of the backbone markers on unused channels. Whole blood was single stained with the markers from the Backbone Panel Block and TSM calculated in Flowjo version 10.8.1. Highlighted cells in the table show the highest spread for reference.
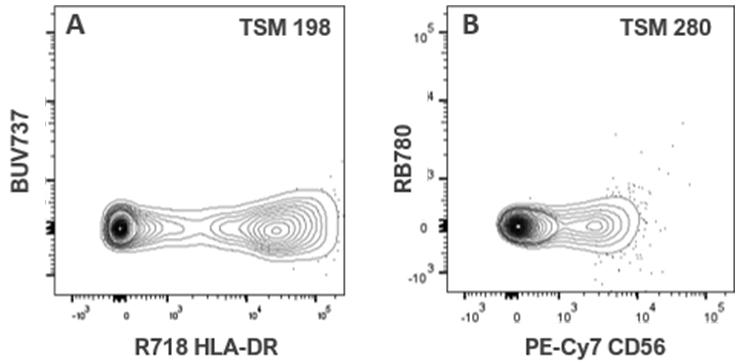
Figure 1. Representative data images from highlighted cells in Table 1. Human whole blood was stained with the Lymphocytes Backbone Panel Block (see above). The effect of R718 HLA-DR on BUV737 (A) and of PE-Cy7 CD56 on RB780 (B) are shown.
T cell Differentiation Panel Block
| Total Spread Into Empty Channels | ||||||||||||||||||
|---|---|---|---|---|---|---|---|---|---|---|---|---|---|---|---|---|---|---|
| Total spread from T Cell Differentiation Panel Block | BUV615 | BUV661 | BUV737 | BV421 | BV480 | BV711 | BV750 | BB700 | RB780 | PE | PE-Cy5 | |||||||
| BV605 CD127 | 16 | 54 | 44 | 0 | 0 | 32 | 77 | 20 | 29 | 67 | 36 | |||||||
| BV650 CD27 | 15 | 214 | 123 | 0 | 0 | 99 | 229 | 34 | 36 | 43 | 86 | |||||||
| BV786 CD28 | 9 | 28 | 54 | 0 | 0 | 30 | 325 | 16 | 52 | 25 | 23 | |||||||
| BB515 CD45RA | 13 | 35 | 27 | 0 | 31 | 23 | 61 | 37 | 47 | 48 | 26 | |||||||
| PE-CF594 CD25 | 9 | 24 | 17 | 0 | 9 | 17 | 33 | 30 | 48 | 76 | 82 | |||||||
| APC CCR7 | 6 | 38 | 38 | 0 | 0 | 20 | 42 | 27 | 33 | 0 | 89 | |||||||
Table 2. A representative TSM showing the impact of the markers in the T cell Differentiation Panel on unused channels. Cells were single stained with the markers from the T cell Differentiation Panel and TSM calculated in Flowjo version10.8.1. Highlighted cells in the table show the highest spread in the panel block.
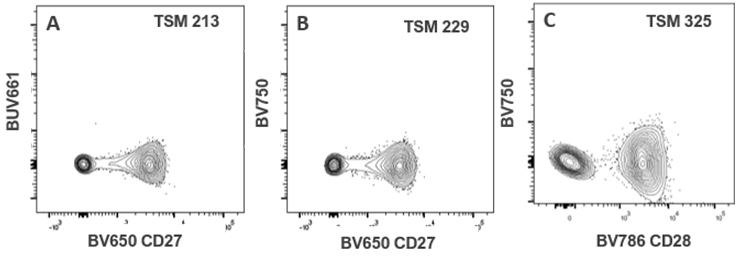
Figure 2. Representative data images from highlighted cells in Table 1. Human blood was stained with the T cell Differentiation Panel Block (see above). The spread from BV650 CD27 into BUV661 (A) and BV750 (B) and from BV786 CD28 into BV750 (C) are shown.
B cell and B cell Subset Panel Blocks.
| Total Spread Into Empty Channels | ||||||||||||||||||
|---|---|---|---|---|---|---|---|---|---|---|---|---|---|---|---|---|---|---|
| Total spread from B cell Maturation and Subsets Panel Blocks | BUV615 | BV421 | BV605 | BV711 | BV750 | BB515 | BB700 | RB780 | PE | PE-Cy5 | APC | |||||||
| BUV661 IgG | 6 | 15 | 23 | 39 | 75 | 0 | 54 | 38 | 0 | 166 | 366 | |||||||
| BUV737 CD20 | 0 | 31 | 0 | 42 | 267 | 0 | 174 | 252 | 0 | 17 | 67 | |||||||
| BV480 IgD | 0 | 0 | 77 | 19 | 53 | 12 | 0 | 0 | 21 | 17 | 0 | |||||||
| BV650 CD27 | 9 | 0 | 56 | 78 | 180 | 5 | 29 | 27 | 30 | 76 | 140 | |||||||
| BV786 CD38 | 8 | 55 | 0 | 26 | 395 | 9 | 0 | 56 | 0 | 24 | 0 | |||||||
| PE-CF594 | 11 | 0 | 42 | 22 | 40 | 0 | 70 | 77 | 152 | 189 | 65 | |||||||
Table 3. A representative TSM showing the impact of the markers in the B cell and B cell Subset Panels on unused channels. Cells were single stained with markers from the B cell and B cell Subset Panel and TSM calculated in Flowjo v10.8.1. Highlighted cells in the table show the highest spread in the panel block.
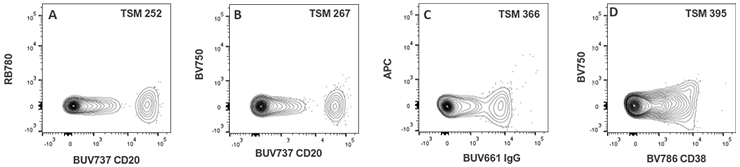
Figure 3. Representative data images from highlighted cells in Table 1. Human blood was stained with the B cell and B cell subset Panel Block (see above). The spread of BUV737 CD20 into RB780 (A) and BV750 (B) and BUV661 IgG into APC (C) and BV786 CD38 into BV750 are shown.
Unconventional T cells and NK cells Panel Block
| Total Spread Into Empty Channels | ||||||||||||||||||
|---|---|---|---|---|---|---|---|---|---|---|---|---|---|---|---|---|---|---|
| Total Spread From Unconventional T cells and NK cell Panel Block | BUV661 | BV421 | BV480 | BV605 | BV650 | BV786 | BB515 | RB780 | PE | PE-CF594 | PE-Cy5 | APC | ||||||
| BUV615 TCRgd | 178 | 0 | 12 | 64 | 27 | 0 | 0 | 30 | 104 | 291 | 102 | 116 | ||||||
| BUV737 CD16 | 19 | 0 | 0 | 28 | 22 | 30 | 0 | 44 | 44 | 16 | 26 | 28 | ||||||
| BV711 CD161 | 32 | 12 | 0 | 58 | 22 | 52 | 0 | 27 | 30 | 0 | 24 | 41 | ||||||
| BV750 CD7 | 31 | 38 | 14 | 76 | 32 | 189 | 22 | 58 | 29 | 29 | 26 | 18 | ||||||
| BB700 TCR Va7.2 | 40 | 0 | 8 | 42 | 25 | 25 | 8 | 46 | 0 | 0 | 0 | 63 | ||||||
Table 4. A representative TSM showing the impact of the markers in the Unconventional T cells and NK cells panel blocks on unused channels. Cells were single stained with the markers from the Unconventional T cells and NK cells panel blocks and TSM calculated in Flowjo version10.8.1. Highlighted cells in the table show the highest spread in the panel block.
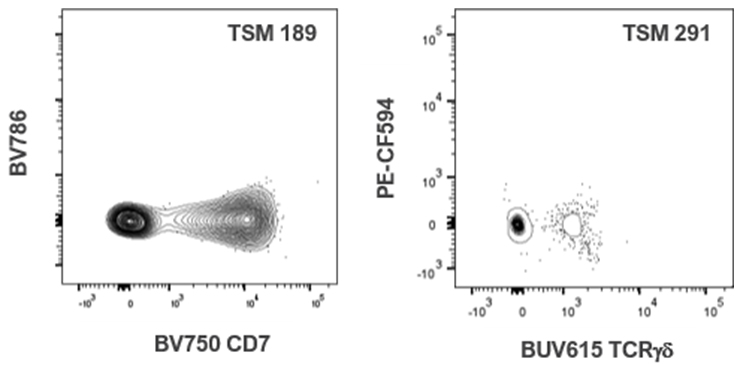
Figure 4. Representative data images from highlighted cells in Table 1. Human blood was stained with the Unconventional T cells and NK cells panel blocks (see above). The spread from BV750 into BV786 (A) and BUV615 TCRgd into PE-CF594 are shown.
Myeloid Backbone Panel Block
| Total Spread Into channels | ||||||||||||||||||||
|---|---|---|---|---|---|---|---|---|---|---|---|---|---|---|---|---|---|---|---|---|
| Total Spread from Myeloid Backbone markers | BUV395 | BUV563 | BUV615 | BUV661 | BUV737 | BV421 | BV480 | BV605 | BV650 | BV711 | BV750 | BB515 | BB700 | RB780 | PE | PE-CF594 | PE-Cy5 | PE-Cy7 | APC | |
| BUV496 CD16 | 429 | 48 | 23 | 101 | 50 | 42 | 197 | 67 | 30 | 23 | 51 | 38 | 22 | 0 | 31 | 71 | 0 | 9 | 46 | |
| BUV805 CD45 | 278 | 20 | 8 | 27 | 54 | 32 | 17 | 39 | 22 | 16 | 133 | 21 | 22 | 98 | 25 | 32 | 15 | 63 | 24 | |
| BV786 CD15 | 143 | 14 | 6 | 34 | 192 | 655 | 14 | 48 | 41 | 74 | 1136 | 8 | 28 | 179 | 22 | 18 | 22 | 96 | 35 | |
| BB515 CD33 | 52 | 17 | 9 | 15 | 17 | 0 | 18 | 73 | 26 | 16 | 39 | 0 | 45 | 44 | 23 | 26 | 11 | 0 | 54 | |
| Alexa 700 HLA-DR | 35 | 59 | 13 | 33 | 48 | 195 | 0 | 44 | 9 | 17 | 75 | 0 | 25 | 41 | 23 | 31 | 30 | 50 | 40 | |
| APC-H7 CD14 | 26 | 0 | 10 | 24 | 37 | 76 | 0 | 42 | 10 | 11 | 144 | 0 | 18 | 120 | 26 | 28 | 26 | 185 | 42 | |
Table 5. A representative TSM showing the impact of the markers in the myeloid backbone panel blocks on unused channels. Cells were single stained with the markers from the myeloid backbone panel block and TSM calculated from total cells gate (indlucing lymphocytes, monocytes, and granulocytes) in Flowjo version 10.8.1. Highlighted cells in the table show the highest spread in the panel block. Red highlight is showing spread over 1000. Assigning a marker to BV750 on a CD15 expressing cell should be avoided.
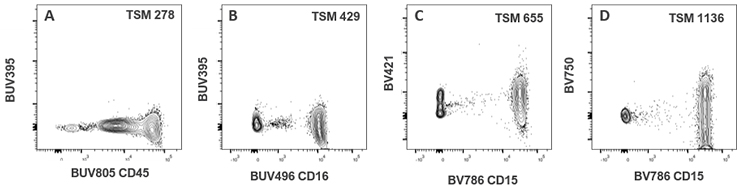
Figure 5. Representative data images from highlighted cells in Table 1. Human blood was stained with the myeloid backbone panel block (see above). The spread from BUV805 CD45 into BUV395 (A) BUV496 CD16 into BUV395 (B), BV786 CD15 into BV421 (C) and BV786 CD15 into BV750 (D) are shown.
The Dendritic Cell (DC) Subset Panel Block
| Total Spread Into channels | ||||||||||||||||||
|---|---|---|---|---|---|---|---|---|---|---|---|---|---|---|---|---|---|---|
| Total Spread from Myeloid Backbone markers | BUV395 | BUV563 | BUV661 | BUV737 | BV421 | BV605 | BV650 | BV711 | BB515 | BB700 | RB780 | PE | PE-CF594 | PE-Cy5 | APC | |||
| BUV615 CD141 | 95 | 39 | 59 | 45 | 57 | 69 | 20 | 16 | 0 | 24 | 35 | 71 | 140 | 64 | 40 | |||
| BV480 CD11c | 111 | 38 | 41 | 34 | 70 | 139 | 32 | 21 | 0 | 20 | 18 | 55 | 55 | 32 | 34 | |||
| BV750 CD1c | 11 | 22 | 1 | 54 | 46 | 20 | 0 | 25 | 0 | 9 | 36 | 16 | 16 | 0 | 10 | |||
| PE-Cy7 CD123 | 28 | 0 | 18 | 40 | 37 | 14 | 0 | 11 | 0 | 66 | 793 | 52 | 47 | 22 | 18 | |||
Table 6. A representative TSM showing the impact of the markers in the dendritic cell (DC) subset panel block on unused channels. Cells were single stained with the markers from the dendritic cell (DC) subset panel block and TSM calculated from total cells gate (indlucing lymphocytes, monocytes, and granulocytes) in Flowjo version 10.8.1. Highlighted cells in the table show the highest spread in the panel block.
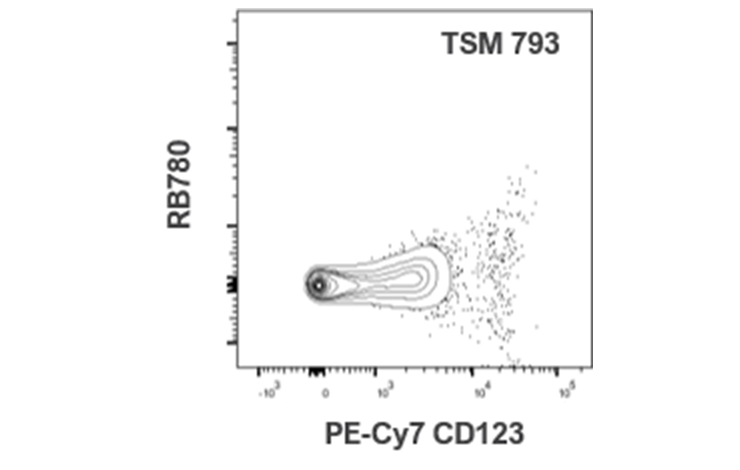
Figure 6. Representative data images from highlighted cells in Table 1. Human blood was stained with the the dendritic cell (DC) subset panel block (see above). The spread from PE-Cy7 CD123 into RB780 channel is shown.
The Granulocyte Panel Block
| Total Spread Into channels | ||||||||||||||||||
|---|---|---|---|---|---|---|---|---|---|---|---|---|---|---|---|---|---|---|
| Total Spread from Myeloid Backbone markers | BUV395 | BUV563 | BUV615 | BUV661 | BUV737 | BV421 | BV480 | BV650 | BV750 | BB515 | BB700 | RB780 | PE | PE-CF594 | PE-Cy5 | PE-Cy7 | ||
| BV605 FcER1a | 91 | 39 | 141 | 199 | 142 | 98 | 69 | 200 | 338 | 0 | 48 | 70 | 359 | 413 | 205 | 92 | ||
| BV711 Siglec 8 | 42 | 12 | 5 | 81 | 333 | 83 | 0 | 88 | 654 | 0 | 80 | 105 | 22 | 22 | 22 | 63 | ||
| APC CD66b | 0 | 8 | 0 | 27 | 32 | 27 | 1 | 18 | 21 | 8 | 21 | 43 | 13 | 18 | 101 | 48 | ||
Table 7. A representative TSM showing the impact of the markers in the granulocyte panel block on unused channels. Cells were single stained with the markers from the granulocyte panel block and TSM calculated from total cells gate (indlucing lymphocytes, monocytes, and granulocytes) in Flowjo version 10.8.1. Highlighted cells in the table show the highest spread in the panel block.
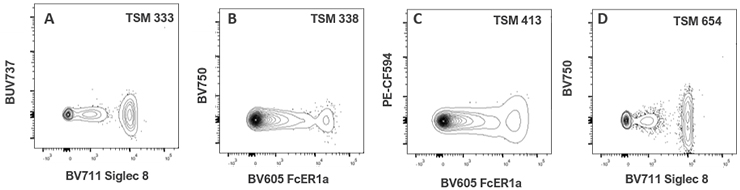
Figure 7. Representative data images from highlighted cells in Table 1. Human blood was stained with the granulocyte panel block (see above). The spread from BV711 Siglec 8 into BUV737 (A) BV605 FcER1a into BV750 (B), BV605 FcER1a intoPE-CF594 (C) and BV711 Siglec 8 into BV750 (D) are shown.
Myeloid-derived Suppressor Cell (MDSC) Panel Block
| Total Spread Into channels | ||||||||||||||||||
|---|---|---|---|---|---|---|---|---|---|---|---|---|---|---|---|---|---|---|
| Total Spread from Myeloid Backbone markers | BUV563 | BUV615 | BUV661 | BUV737 | BV421 | BV480 | BV605 | BV650 | BV711 | BV750 | BB515 | BB700 | RB780 | PE | PE-CF594 | PE-Cy5 | PE-Cy7 | |
| BUV395 CD11b | 0 | 7 | 0 | 0 | 0 | 0 | 0 | 0 | 0 | 0 | 0 | 0 | 0 | 0 | 21 | 0 | 0 | |
| BV786 CD15 | 14 | 6 | 34 | 192 | 655 | 14 | 48 | 41 | 74 | 1136 | 8 | 28 | 179 | 22 | 18 | 22 | 96 | |
| APC CD66b | 8 | 0 | 27 | 32 | 27 | 1 | 35 | 18 | 12 | 21 | 8 | 21 | 43 | 13 | 18 | 101 | 48 | |
Table 8. A representative TSM showing the impact of the markers in the myeloid-derived suppressor cell (MDSC) panel block on unused channels. Cells were single stained with the markers from the myeloid-derived suppressor cell (MDSC) panel block and TSM calculated from total cells gate (indlucing lymphocytes, monocytes, and granulocytes) in Flowjo version 10.8.1. Highlighted cells in the table show the highest spread in the panel block. Red highlight is showing spread over 1000. Assigning a marker to BV750 on a CD15 expressing cell should be avoided.
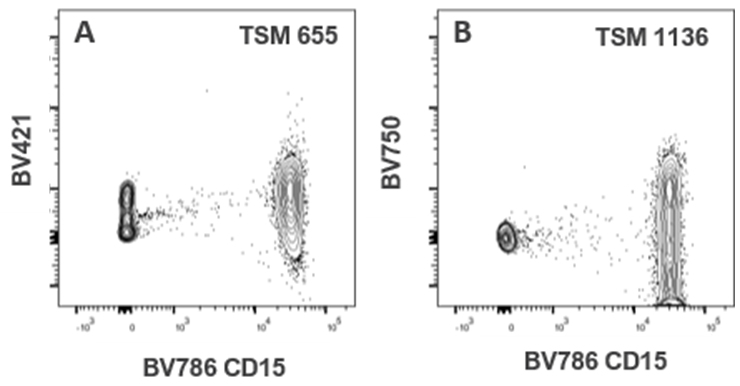
Figure 8. Representative data images from highlighted cells in Table 1. Human blood was stained with the myeloid-derived suppressor cell (MDSC) panel block (see above). The spread from BV786 into BV421 (A) and BV750 (B) are shown.
BD FACSymphony™ A3 Instrument Configuration
| Lasers | Filter | LP Mirror | Fluorochrome |
| UV 355 nm 100 mW |
379/28 | 370 | BUV395 |
| 515/30 | 490 | BUV496 | |
| 580/20 | 550 | BUV563 | |
| 610/20 | 600 | BUV615 | |
| 670/20 | 630 | BUV661 | |
| 735/30 | 690 | BUV737 | |
| 810/40 | 770 | BUV805 | |
| Violet 405 nm 100 mW |
431/28 | 410 | BV421 |
| 525/50 | 505 | BV480/BV510 | |
| 586/15 | 550 | BV570 | |
| 605/40 | 595 | BV605 | |
| 677/20 | 635 | BV650 | |
| 710/50 | 685 | BV711 | |
| 750/30 | 735 | BV750 | |
| 810/40 | 770 | BV786 | |
| Blue 488 nm 100 mW |
488/10 | N.A. | SSC |
| 530/30 | 505 | BB515 | |
| 610/20 | 600 | BB630-P2 | |
| 670/30 | 635 | BB660-P2 | |
| 710/50 | 685 | BB700 | |
| 750/30 | 735 | BB755-P | |
| 810/40 | 770 | BB790-P | |
| Yellow-Green 561 nm 100 mW |
586/15 | 570 | PE/BYG584-P |
| 610/20 | 600 | PE-CF594 | |
| 670/30 | 635 | PE-Cy5 | |
| 780/60 | 750 | PE-Cy7 | |
| Red 637 nm 140 mW |
670/30 | 655 | APC |
| 730/45 | 690 | AF700/R718 | |
| 780/60 | 750 | APC-Cy7 |
Table 9. All TSM matrices were collected on the BD FACSymphony™ A3 configuration as shown.